Когда вам нужно заняться научными темами, визуализацией данных (или, проще всего, созданием диаграмм для панелей мониторинга), круговые диаграммы, без сомнения, являются одним из наиболее используемых и широко известных способов отображения простых данных. Круговые диаграммы используются для отображения процентной доли от общего значения, поэтому все срезы (сегменты) должны составлять до 100%. Если вы хотите отобразить этот вид диаграммы в своем приложении WinForms, мы рекомендуем вам использовать для этого библиотеку, а не рисовать ее с использованием классов рисования .NET
В этой статье мы покажем вам, как отображать круговую диаграмму в приложении WinForms с C # с помощью библиотеки LiveCharts.
1. Установите LiveCharts
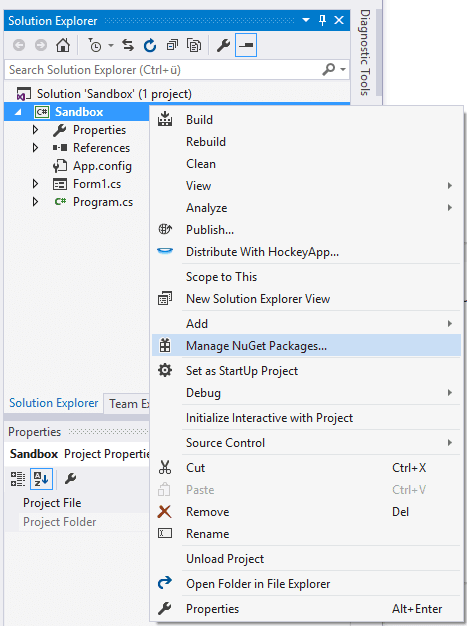
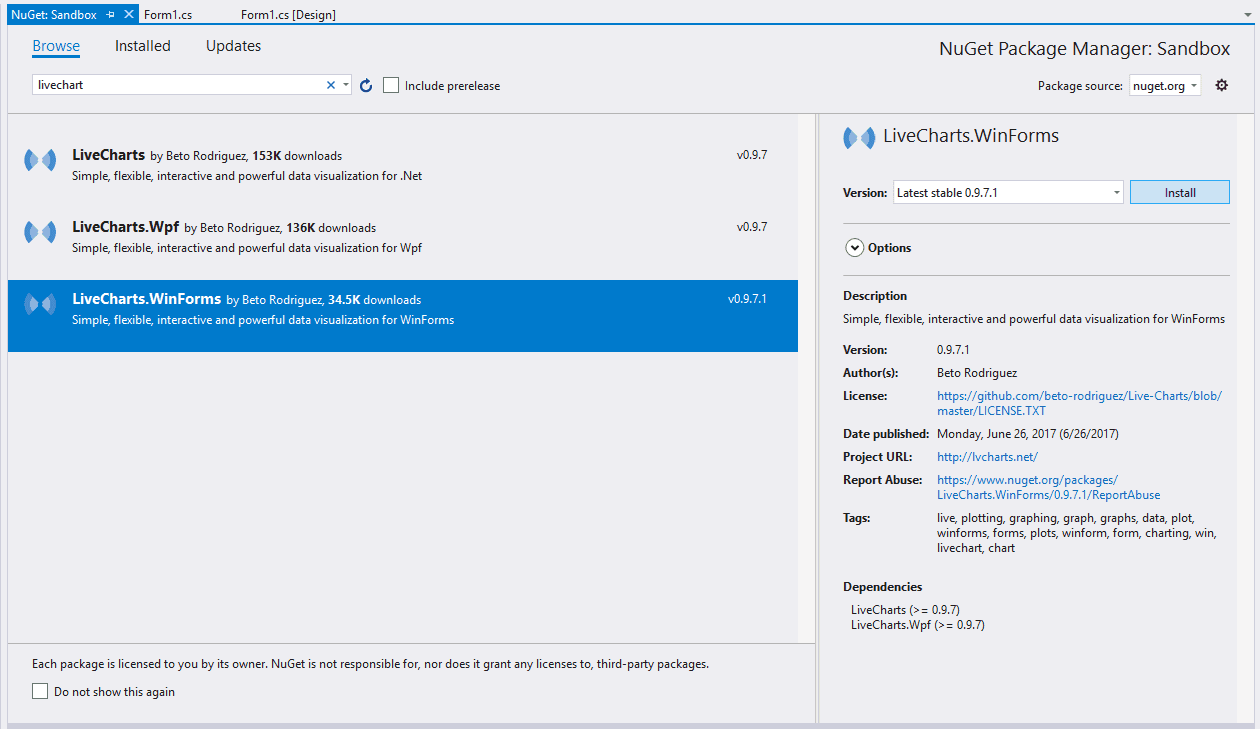
Чтобы установить этот пакет в свой проект в Visual Studio, перейдите в обозреватель решений и щелкните правой кнопкой мыши свой проект. В раскрывающемся списке выберите параметр «Управление пакетами NuGet»:
В диспетчере перейдите на вкладку просмотра и найдите пакет LiveCharts:
Выберите пакет WinForms от Beto Rodriguez и установите его в свой проект. После завершения установки вы сможете использовать библиотеку для отображения диаграмм в вашем коде. Для получения дополнительной информации об этой библиотеке, пожалуйста, посетите официальный репозиторий на Github здесь.
2. Добавьте компонент PieChart
После установки библиотеки LiveCharts в проект автоматически Visual Studio добавит новый набор элементов управления, позволяющих добавлять диаграммы в макет WinForms. Вы можете найти его в левой части Visual Studio при открытии дизайнера форм. Чтобы начать с примера из этой статьи, мы добавим элемент PieChart, поэтому просто перетащите его и поместите в форму:
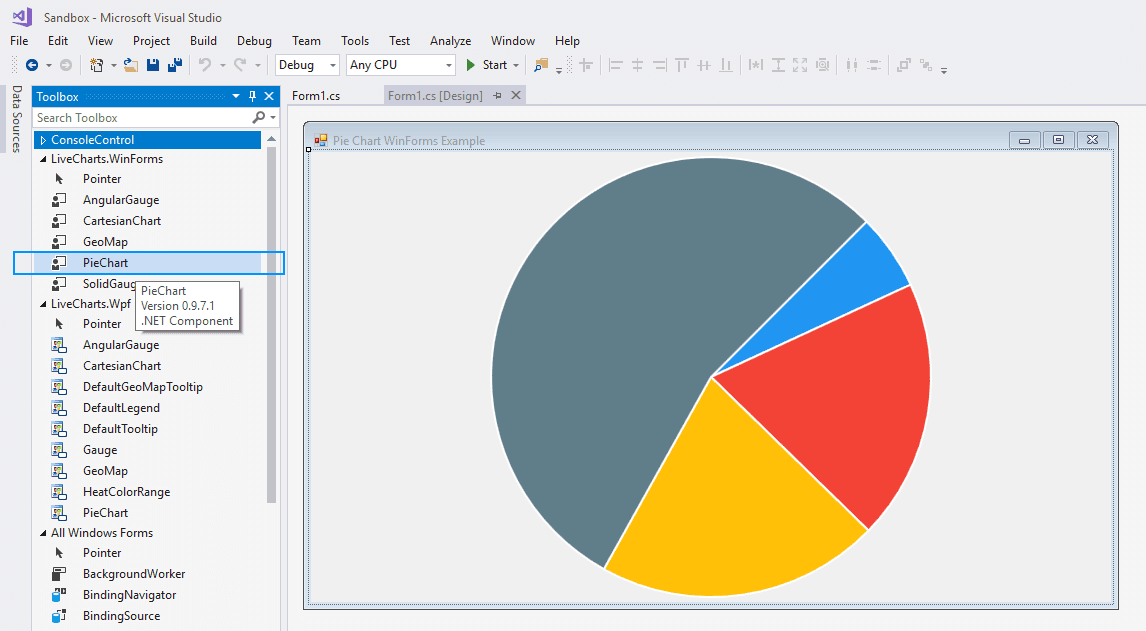
Это добавит изображение по умолчанию, чтобы вы знали, что пространство занято этим компонентом (данные не имеют смысла). По умолчанию первый элемент в коде будет назван pieChart1, однако вы можете изменить имя компонента позже. В наших примерах мы сохраним то же имя первого элемента.
3. Отображение данных на круговой диаграмме
Теперь, когда ваша форма отображает PieChart графически, вам нужно установить некоторые данные, которые будут отображаться. Во-первых, вам нужно определить коллекцию данных, которая содержит PieSeries элементы, эти элементы могут быть динамически или статически определены в SeriesCollection объект. каждый PieSeries объекту нужен как минимум заголовок, LabelPoint и значения параметров, определенные для правильного отображения. Значение каждого элемента может быть определено с новым экземпляром ChartValues класс с его типом и его примитивным значением.
Данные в коллекции могут быть динамически добавлены по мере необходимости или определены сразу в конструкторе SeriesCollection:
// Include the required namespace of LiveCharts
using LiveCharts;
using LiveCharts.Wpf;
// It's important to run the code inside the load event of the form, so the component will be drawn after this correctly
private void Form1_Load(object sender, EventArgs e)
{
// Define the label that will appear over the piece of the chart
// in this case we'll show the given value and the percentage e.g 123 (8%)
Func labelPoint = chartPoint => string.Format("{0} ({1:P})", chartPoint.Y, chartPoint.Participation);
// Define a collection of items to display in the chart
SeriesCollection piechartData = new SeriesCollection
{
new PieSeries
{
Title = "First Item",
Values = new ChartValues {25},
DataLabels = true,
LabelPoint = labelPoint
},
new PieSeries
{
Title = "Second Item",
Values = new ChartValues {25},
DataLabels = true,
LabelPoint = labelPoint
},
new PieSeries
{
Title = "Third Item",
Values = new ChartValues {25},
DataLabels = true,
LabelPoint = labelPoint
}
};
// You can add a new item dinamically with the add method of the collection
// Useful when you define the data dinamically and not statically
piechartData.Add(
new PieSeries{
Title = "Fourth Item",
Values = new ChartValues { 25 },
DataLabels = true,
LabelPoint = labelPoint,
Fill = System.Windows.Media.Brushes.Gray
}
);
// Define the collection of Values to display in the Pie Chart
pieChart1.Series = piechartData;
// Set the legend location to appear in the Right side of the chart
pieChart1.LegendLocation = LegendLocation.Right;
}
Как уже упоминалось, код должен выполняться после / во время события загрузки формы. В следующем примере отображается график, отображаемый в начале статьи, в котором показано количество и процент ядерных боеголовок в странах:
using System;
using System.Windows.Forms;
// Include the required namespace of LiveCharts
using LiveCharts;
using LiveCharts.Wpf;
namespace Sandbox
{
public partial class Form1 : Form
{
public Form1()
{
InitializeComponent();
}
private void Form1_Load(object sender, EventArgs e)
{
// Define the label that will appear over the piece of the chart
// in this case we'll show the given value and the percentage e.g 123 (8%)
Func labelPoint = chartPoint => string.Format("{0} ({1:P})", chartPoint.Y, chartPoint.Participation);
// Define the collection of Values to display in the Pie Chart
pieChart1.Series = new SeriesCollection
{
new PieSeries
{
Title = "USA",
Values = new ChartValues {6450},
DataLabels = true,
LabelPoint = labelPoint,
},
new PieSeries
{
Title = "Russia",
Values = new ChartValues {6850},
DataLabels = true,
LabelPoint = labelPoint
},
new PieSeries
{
Title = "United Kingdom",
Values = new ChartValues {215},
DataLabels = true,
LabelPoint = labelPoint
},
new PieSeries
{
Title = "France",
Values = new ChartValues {300},
DataLabels = true,
LabelPoint = labelPoint
},
new PieSeries
{
Title = "China",
Values = new ChartValues {280},
DataLabels = true,
LabelPoint = labelPoint
}
};
// Set the legend location to appear in the bottom of the chart
pieChart1.LegendLocation = LegendLocation.Bottom;
}
}
}
4. Настройка PieChart
Для настройки, которая нужна почти каждому, это в основном функции. Например, чтобы изменить цвет, вам нужно определить цвет заливки System.Windows.Media.Brushes герметичный класс:
new PieSeries
{
Title = "Second Item",
Values = new ChartValues {25},
DataLabels = true,
LabelPoint = labelPoint,
// Define the piece with a green color
Fill = System.Windows.Media.Brushes.Green
}
Или, если вы хотите выделить кусок из круговой диаграммы, используйте PushOut опция:
new PieSeries
{
Title = "Second Item",
Values = new ChartValues {25},
DataLabels = true,
LabelPoint = labelPoint,
// Highligh this piece of the chart
PushOut = 15,
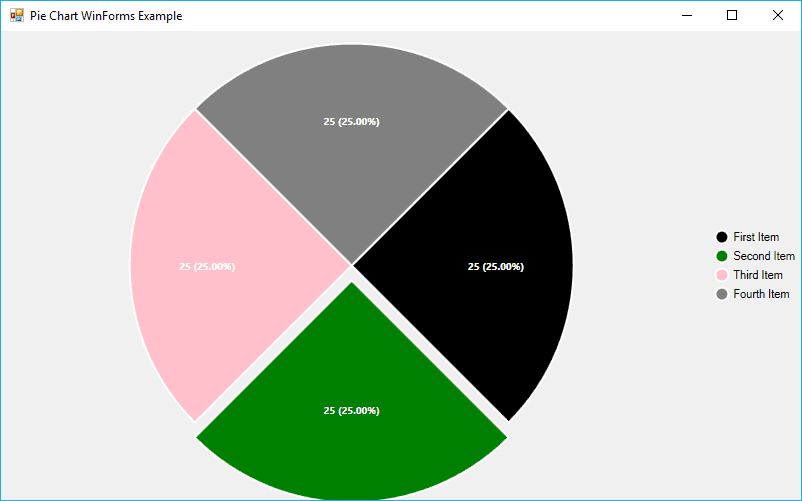
}Следующий код:
// Define the label that will appear over the piece of the chart
// in this case we'll show the given value and the percentage e.g 123 (8%)
Func labelPoint = chartPoint => string.Format("{0} ({1:P})", chartPoint.Y, chartPoint.Participation);
SeriesCollection piechartData = new SeriesCollection
{
new PieSeries
{
Title = "First Item",
Values = new ChartValues {25},
DataLabels = true,
LabelPoint = labelPoint,
// Define a custom Color
Fill = System.Windows.Media.Brushes.Black
},
new PieSeries
{
Title = "Second Item",
Values = new ChartValues {25},
DataLabels = true,
LabelPoint = labelPoint,
Fill = System.Windows.Media.Brushes.Green,
PushOut = 15
},
new PieSeries
{
Title = "Third Item",
Values = new ChartValues {25},
DataLabels = true,
LabelPoint = labelPoint,
Fill = System.Windows.Media.Brushes.Pink
}
};
// You can add a new item dinamically with the add method of the collection
piechartData.Add(
new PieSeries{
Title = "Fourth Item",
Values = new ChartValues { 25 },
DataLabels = true,
LabelPoint = labelPoint,
Fill = System.Windows.Media.Brushes.Gray
}
);
// Define the collection of Values to display in the Pie Chart
pieChart1.Series = piechartData;
// Set the legend location to appear in the bottom of the chart
pieChart1.LegendLocation = LegendLocation.Right;
Будет генерировать следующий график: